Why Data Visualisation?
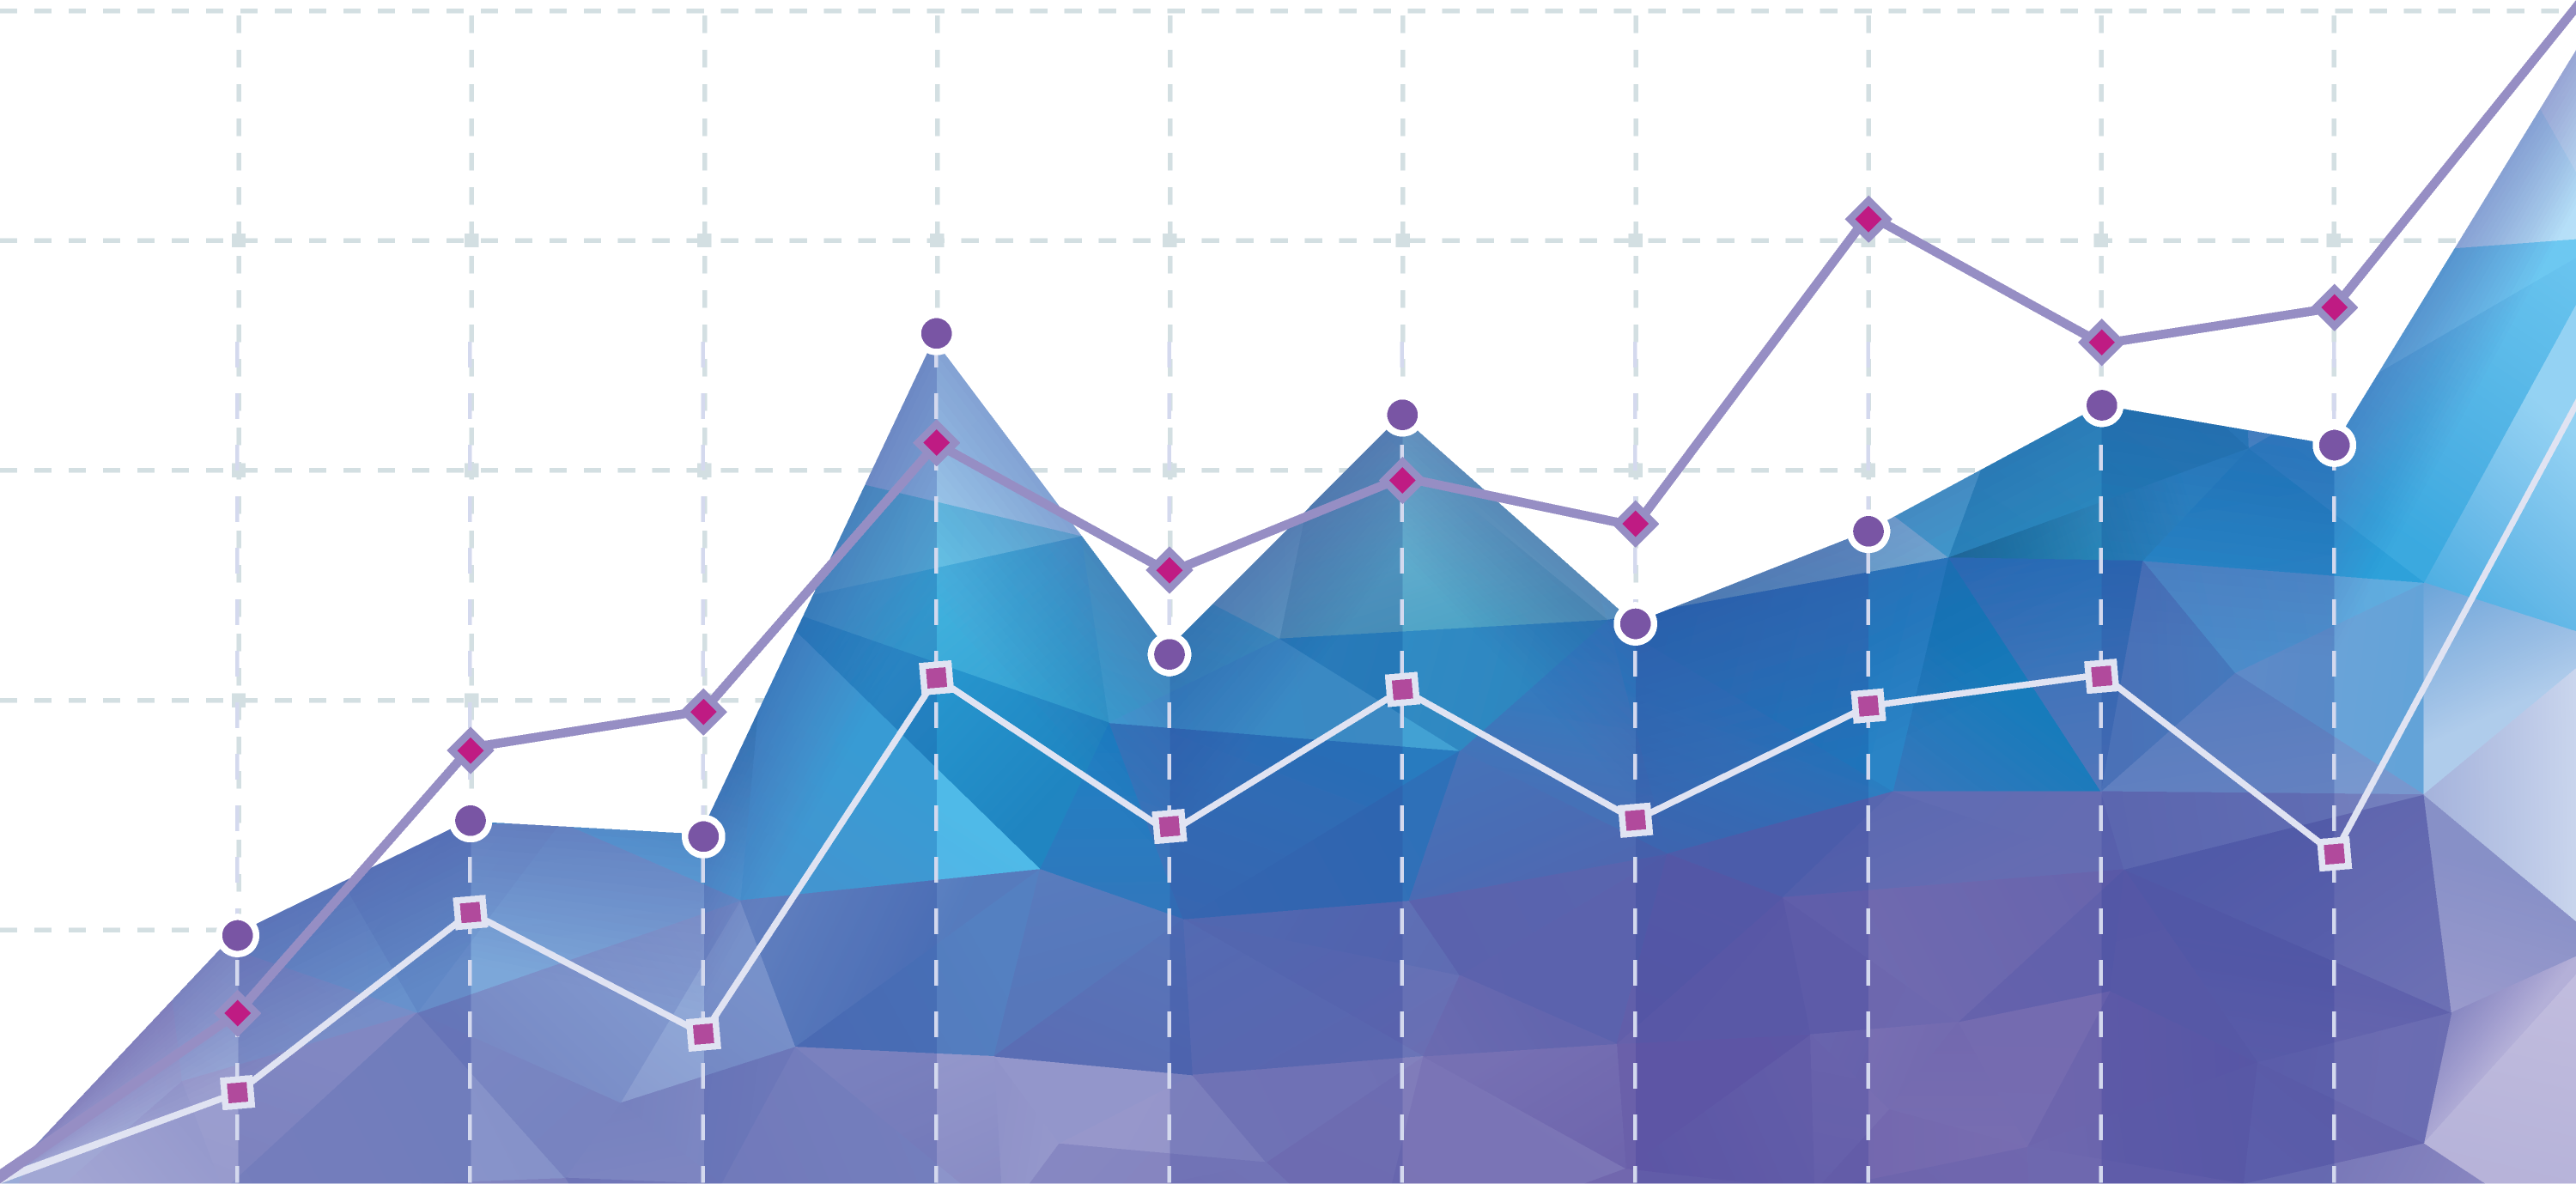
Data visualization is a collective term that describes a procedure that converts data into visually perceivable form to help the reader understand the significance of the said data. Patterns, trends, and correlations that might go undetected in text-based data can be exposed and recognized more comfortable with data visualization software.
Understanding and reading data visualizations have become a requirement for the 21st century. Because data visualization tools have been made readily available, it is expected of non-technical professionals to be able to gather insights from data.
As data visualization service providers extend the functionality of these tools, using has been increasing as front ends for more big data environments.
As data visualization service providers extend the functionality of these tools, using has been increasing as front ends for more big data environments.
Data visualization software helps data analysts and engineers keep track of data sources and perform fundamental analysis of data sets to assist in more detailed advanced reviews. Data visualization tools have been essential in emulating data and analytics and making data perceivable for workers throughout an organization.

In the present time more than ever, businesses are using data visualizations as a tool to gain a better understanding of data and make more informed decisions. Upcoming computer software programs have made it easier to learn more about a company and make data-related business decisions.
They have a strong emphasis on data dashboards, and Key Performance Indicators (KPIs) shows the requirement of measuring and monitoring company data. Standard quantitative information measured by businesses includes employee stats, units or product sold, department expenses, revenue by quarter, and company market share.
Data visualizations and infographics have become an essential tool for today’s media. Data journalism is rising and relies on quality visualizations tools for assistance in telling stories about the world around us. Many media institutions have embraced data-driven news, including CNN, Bloomberg, The New York Times, The Guardian, Scientific American, The Washington Post, The Economist, and The Huffington Post.


Data visualization software allows the user to present the data the best way possible as per selection made by the user, but, slowly, the tool automates this step. Some software intuitively detects correlations between particular variables, interprets the shape of the data and then place these discoveries into the chart type.
Data visualization also plays a vital role in executing big data and advanced analytics projects. As businesses accumulate a large amount of data during the early years of the big data trend, they re1uire a way to quickly and easily get an overview of their data. Data visualization tools are a natural fit. It has become central to advanced analytics for the same reasons. If a data scientist is working on advanced predictive analytics or any other algorithms, it becomes vital to visually comprehend the outputs to monitor results and ensure that models are performing as intended. Visualizations of complex algorithms are more comfortable to interpret than digital outputs.
Data visualization also plays a vital role in executing big data and advanced analytics projects. As businesses accumulate a large amount of data during the early years of the big data trend, they re1uire a way to quickly and easily get an overview of their data. Data visualization tools are a natural fit. It has become central to advanced analytics for the same reasons. If a data scientist is working on advanced predictive analytics or any other algorithms, it becomes vital to visually comprehend the outputs to monitor results and ensure that models are performing as intended. Visualizations of complex algorithms are more comfortable to interpret than digital outputs.

Marketers also benefit significantly from the combination of quality data and emotional narration. Data-driven decisions are made marketers daily, but sharing the same with their consumers requires them to share their message using statistics and heart.
Data visualization is a different approach for marketers to reach out to the customer both intelligently and emotionally.
