Data Visualization Work
Tableau
Digitalyx USA
Marketing Analytics
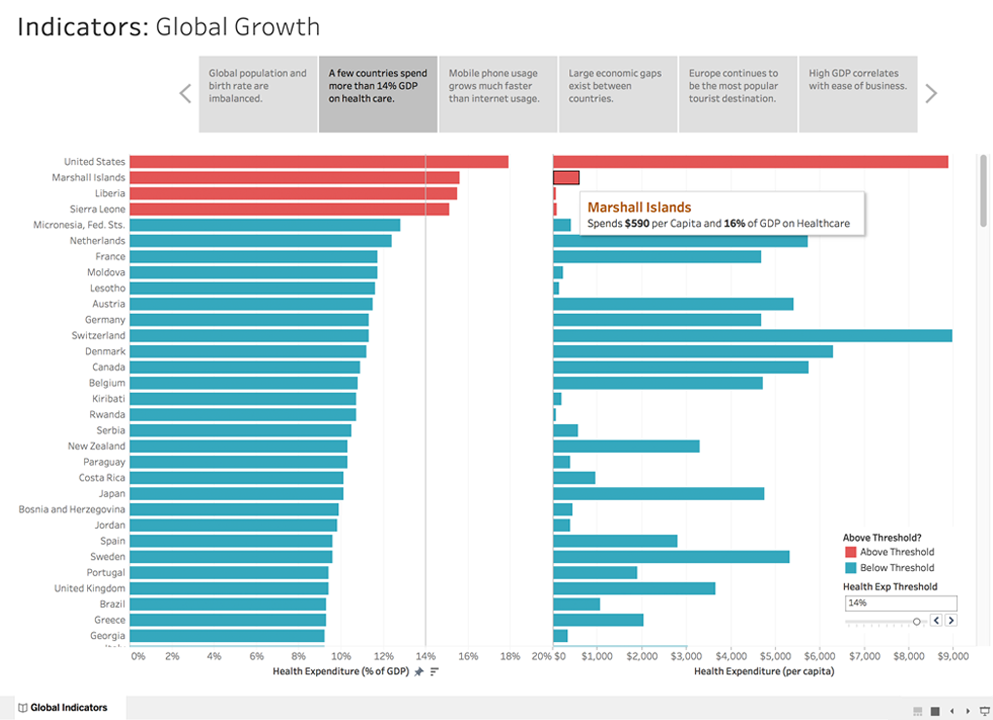
Digitaly uses Tableau for measuring, managing and analyzing marketing performance to maximize return on investment (ROI).
One of the basic questions B2B content marketers ask is how effective is my content in relation to my business goals. The answers help in determining what to promote and which topics to write about next. In the case, we provided a bubble chart which places the posts on the grid and describes 3 parameters for each post: traffic, conversion score (how many times it participated in the customer journey) and a number of conversions.
Power BI
MONAG International Inc.
E-Commerce
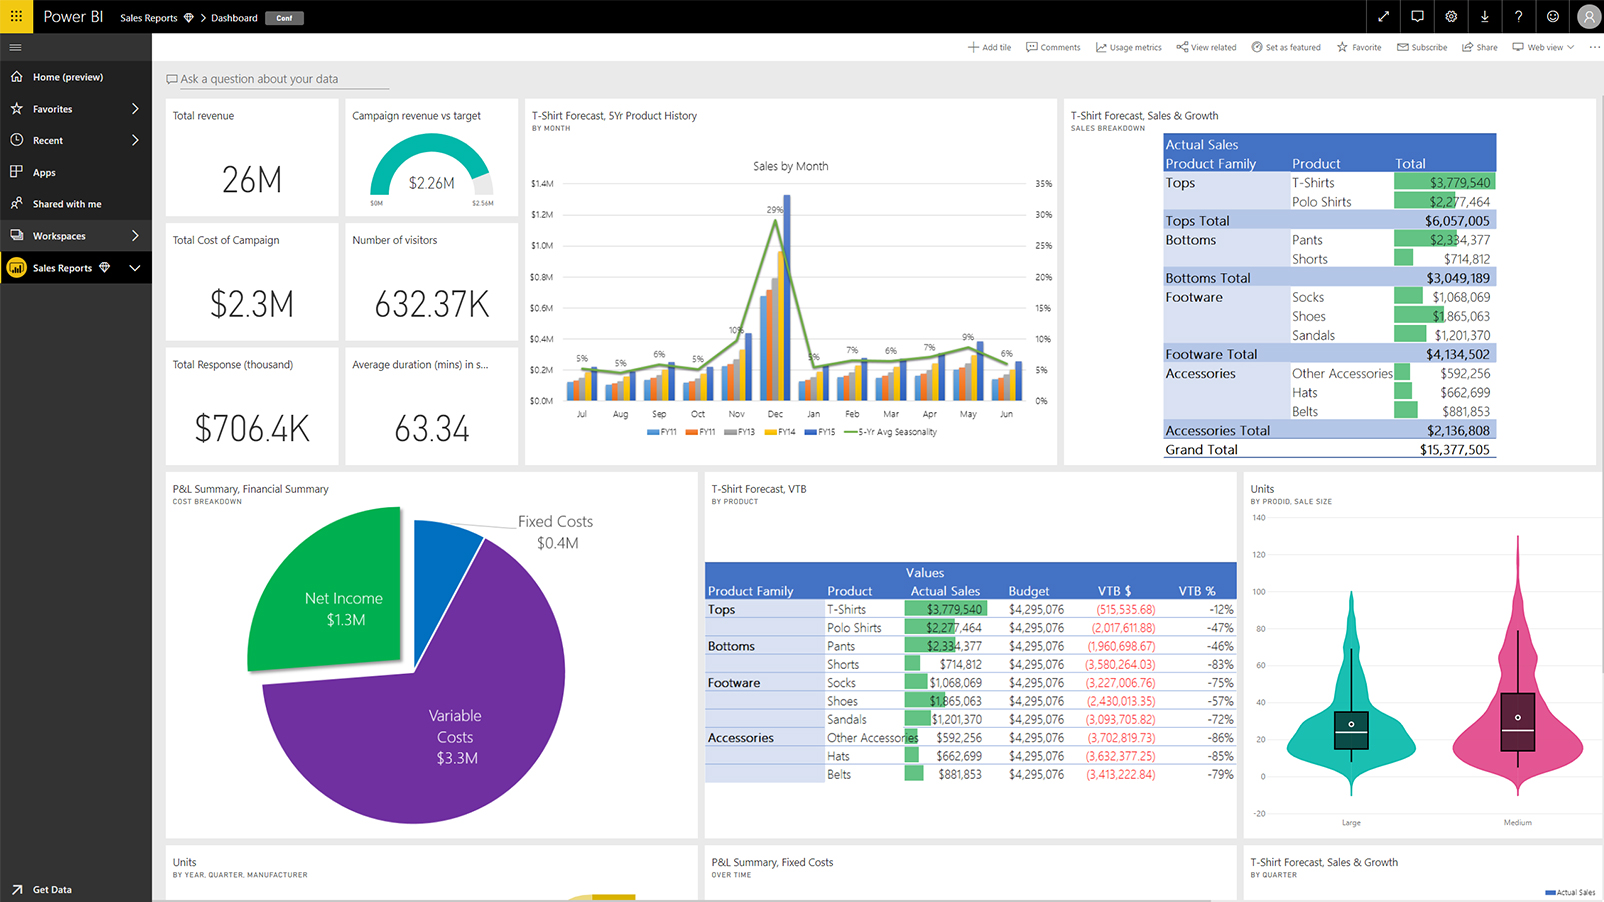
Due to it’s large catalog, the number of distribution centers, and complexity of an eCommerce site, there were multiple challenges to establish the basic performance metrics to compare this year’s performance to last year’s in these areas: sales, units, gross margin, and variance, as well as new store analysis. Once we achieve the milestone, we fine-tuned the advanced metrics for industry related performances.
QLIK
Creative Video Production Co.
San Francisco
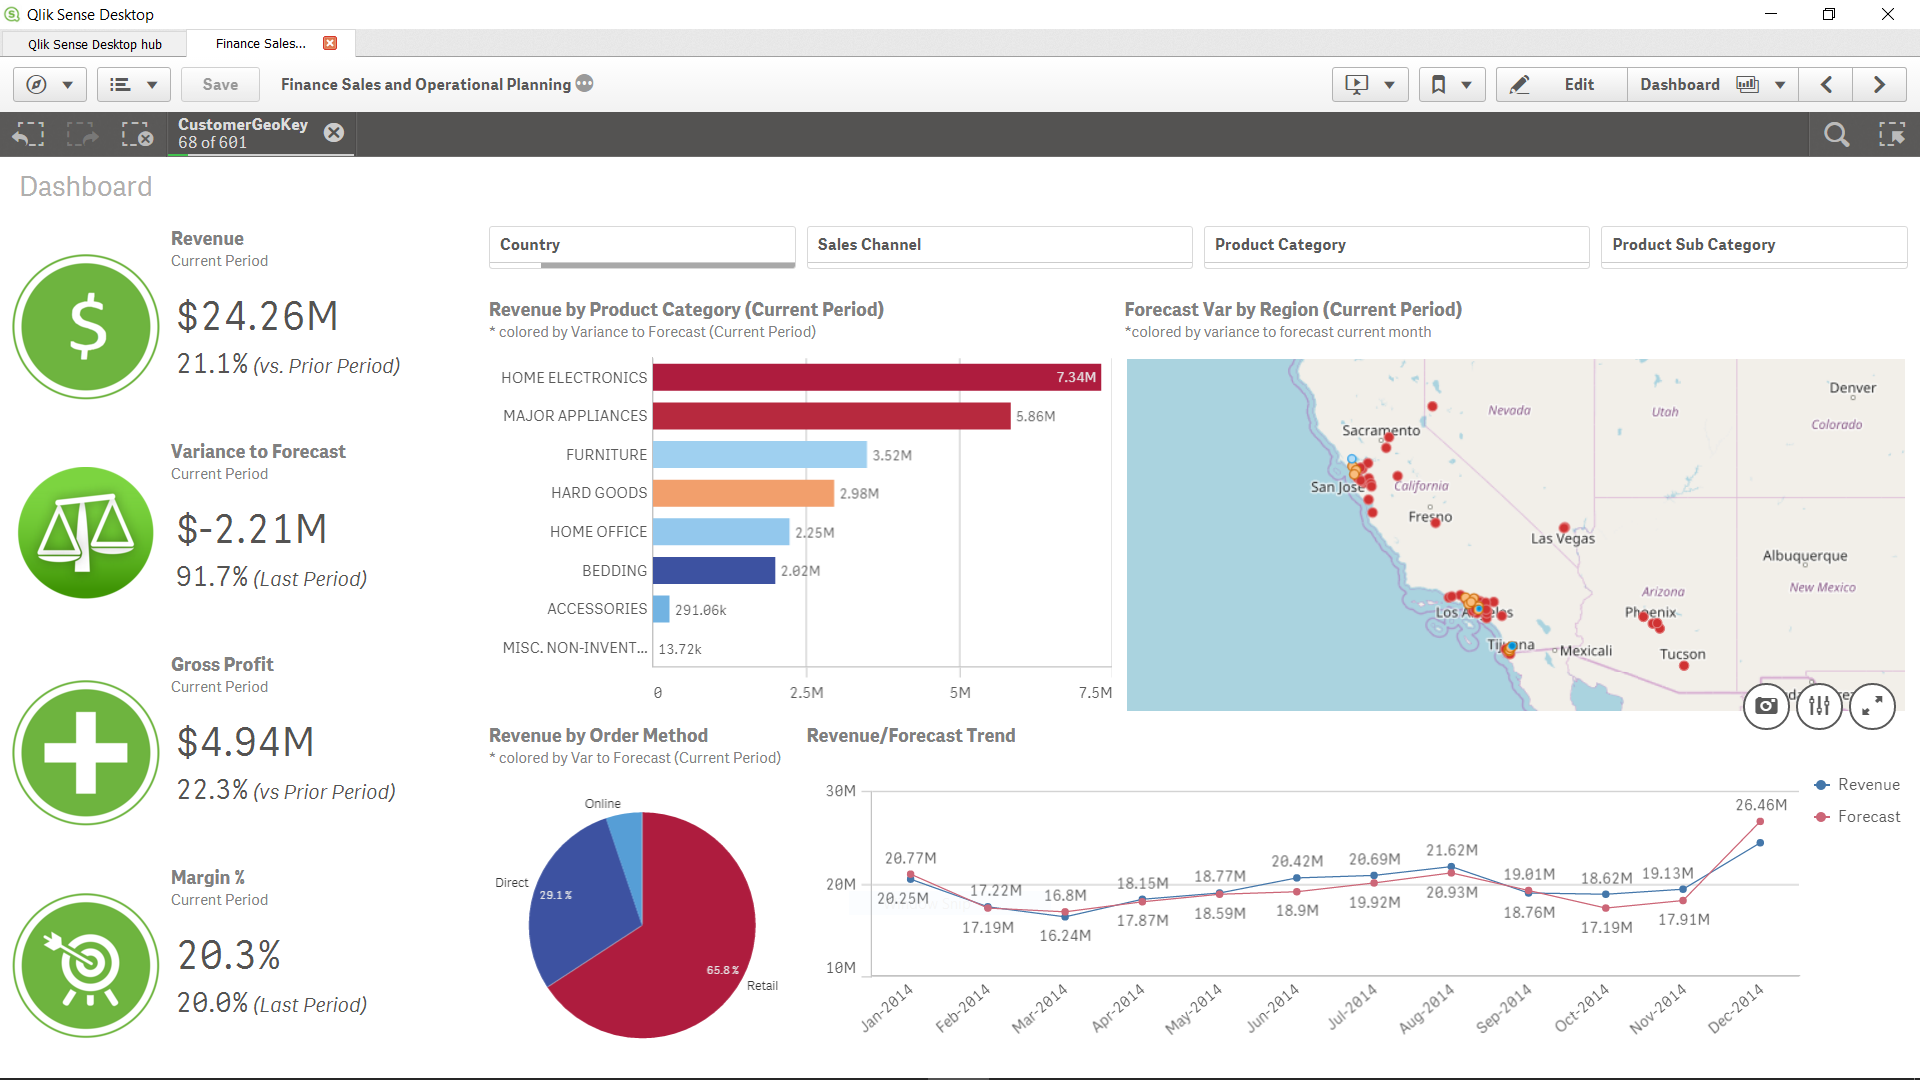
That’s where and how the story has begun. Highering AI’s Qlik COE (center of excellence) team worked with the highly creative client team to not only familiarize them with self-service capabilities of Qlik Sense, but we also leveraged the Qlik Sense’s data storytelling features to enhance CVPC’s outreach.
Highering AI
Success in creating AI would be the biggest event in human history. Unfortunately, it might also be the last, unless we learn how to avoid the risks.
Stephen Hawking
© 2025 Highering LLC
MEET HIGHERING AI
NEED HELP?


