Data Visualization with Power BI
Monag prioritizes premium quality always.

Power BI
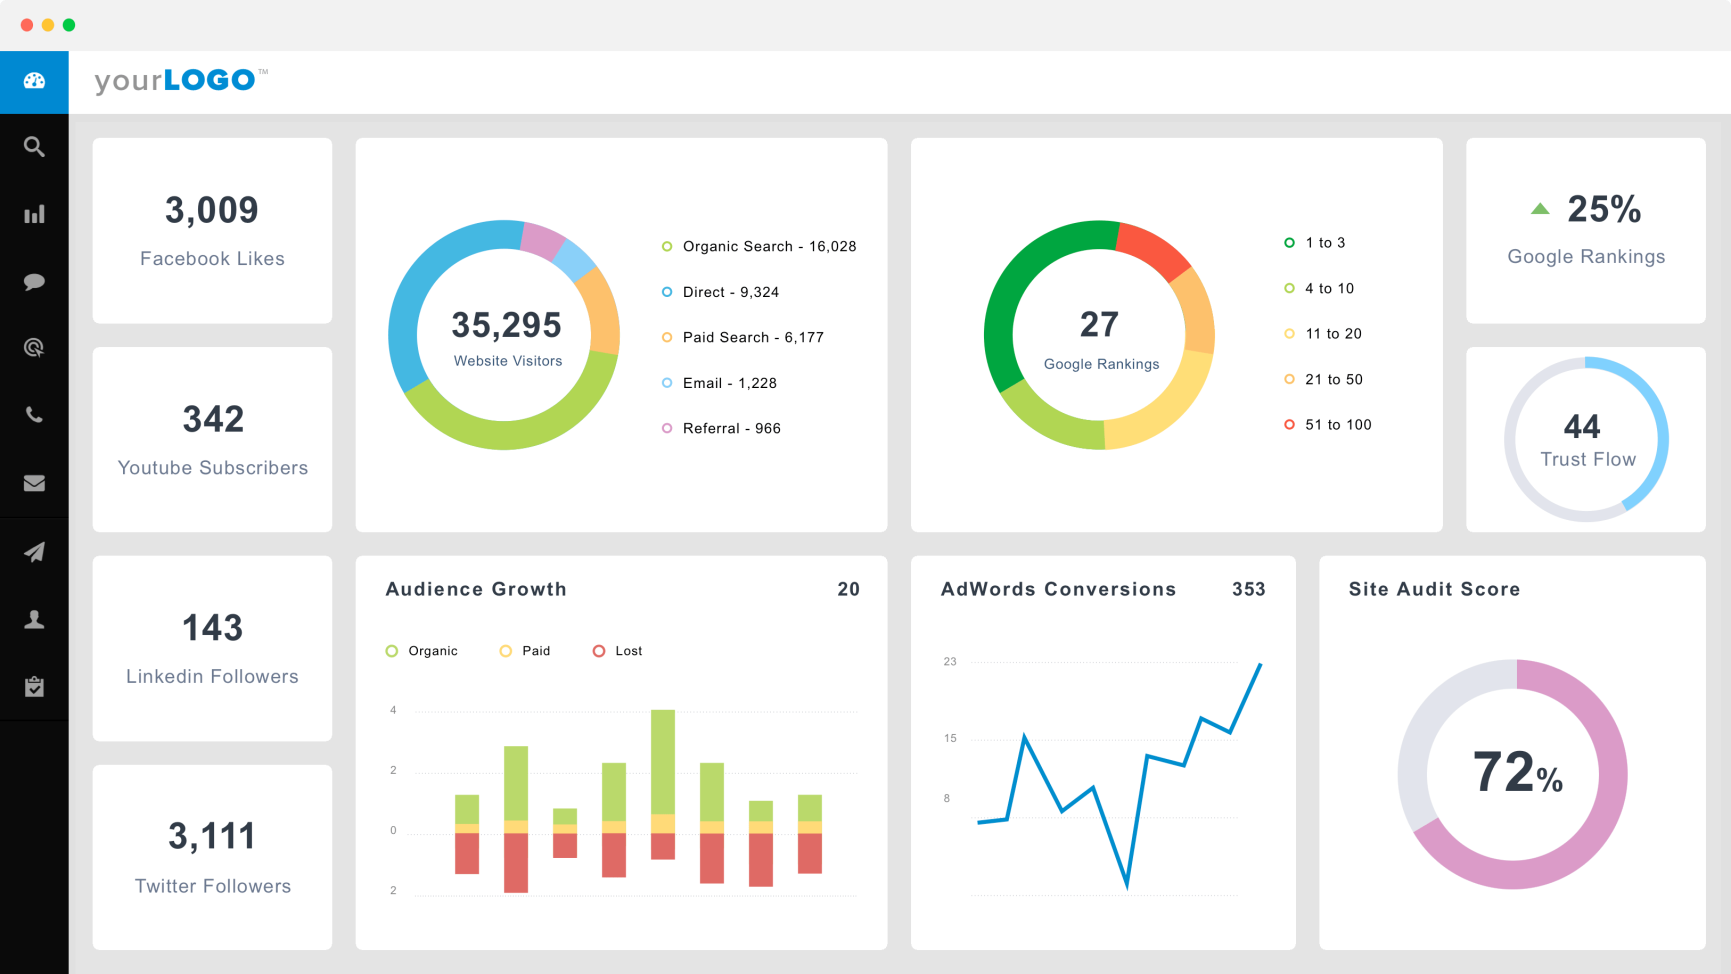
Power BI is a business analytics service that delivers insights to enable fast, informed decisions.
- Transform data into stunning visuals and share them with colleagues on any device.
- Visually explore and analyze data—on-premises and in the cloud—all in one view.
- Collaborate on and share customized dashboards and interactive reports.
- Scale across your organization with built-in governance and security.
Project summary
The Strategy
Proven Results
Monag analysts can compile, share, and convey meaning in half the time they once required. “Being able to visualize actionable data, instead of looking at rows and rows of numbers, has given us a much clearer idea of how we need to optimize,” says the CEO. “We can find gaps, see what markets each of our products are doing best in, and act on that data before its gone stale.”
%
Search Traffic
%
Conversion Rate
Top 5 Keywords
%
Online Leads
More Successful Projects
We are Digitaly, check out our other SEO projects and collaborations here.

Digitaly - Tableau

Creative Video Production Co. - Qlik
Let's Work Together!
To craft the best Data Visualization outcome, we know that this is not enough to secure the most suitable keyword or content but we need stay agile together to outshine the competitors as well the search engines’ ever-changing algorithms.
.
Location
Santa Clara CA 95051
(+1) 425 999 4323
sales@highering.us

